Keeping a world championship live: one developer, 990 runners and 2.4 million visits
What it took to build, run and protect the live results of the 2026 Big's Backyard Ultra World Team Championship on my own: the pressure, the safety nets, the two times something went wrong, and how many people around the world it served.
- Written by
- Naresh Kumar
- Published
- Reading time
- 8 min
- Topic
- Client stories
For six days in October, 990 runners in 67 countries ran the 2026 Big’s Backyard Ultra World Team Championship, and the live results dashboard I built, wtc2026.bigsbackyardultra.com, was how much of the world followed them.
I’ve already written about how it was built. This post is about the other half of the job, the half nobody sees: keeping it running. Because I wasn’t only the developer. I was also the one looking after the infrastructure, the monitoring, the deploys and the 3 am checks, and I carried a quiet fear the whole week: what if something goes wrong while everyone is watching?
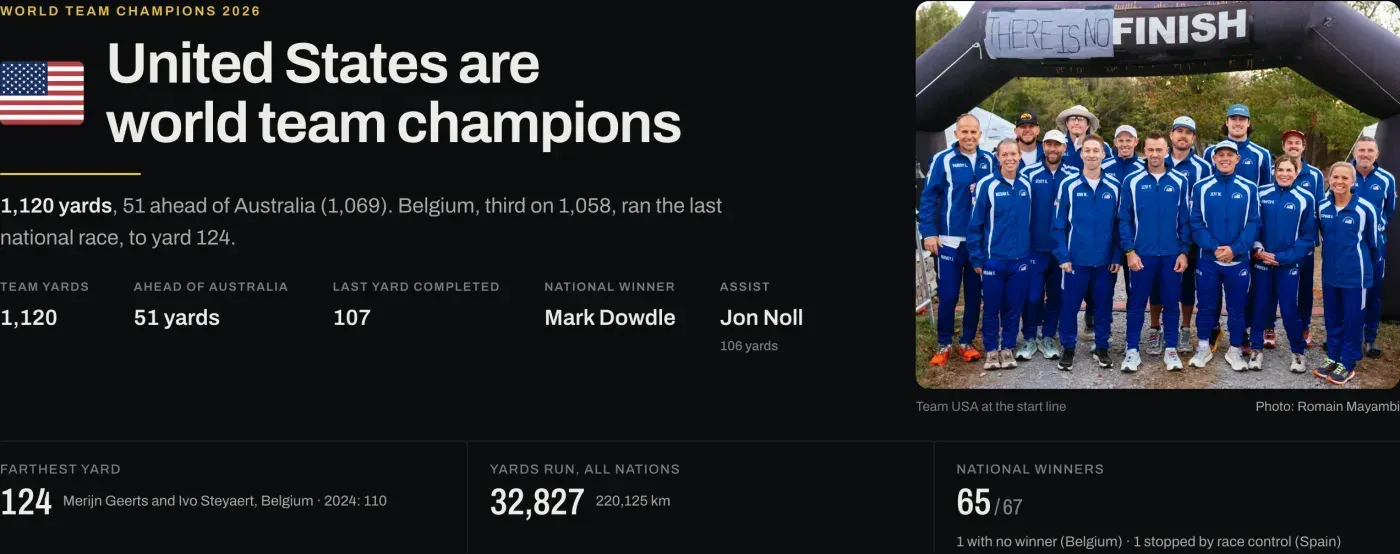
The end of the race: the United States world team champions on 1,120 yards, 51 ahead of Australia. Photo of Team USA at the start line by Romain Mayambi.
The weight of it
The planning and the design ideas had been forming for a couple of months, but the website itself was built in four days. The first production version went live on the Wednesday; the race started on the Saturday. There was no long soak period, no months of real traffic to learn from. The first time the site met the world was the moment the world arrived.
Once the race started, it ran day and night for five days. Every hour, on the hour, results came in from 67 race directors in every time zone, and thousands of people were refreshing, sharing and arguing about them. If the numbers were wrong, or the page went blank, people would notice immediately, and they would be right to.
What kept me steady was one fact I held on to: the official results always lived in the Google Sheet. The race directors typed them there and the officials checked them there. Whatever happened to my site, the record of the race was safe, and the site had a link to that sheet on every page. The dashboard was a window onto the data, not the data itself. That didn’t make the pressure go away, but it meant a bad hour on my side could never lose anyone’s result.
The safety nets I put in before the start
I didn’t want to find out how the site behaved under stress by watching it fail. So before the first runner started, I built for the bad days:
- It never shows a blank page. The browser never talks to Google. One small worker reads the sheet once a minute and publishes a checked copy; if a read fails, visitors keep seeing the last good results, marked “Delayed”, instead of an error.
- It checks itself against the source. Every 10 minutes an independent audit compared what visitors were seeing with the official sheet, runner by runner. If they ever disagreed, I would get an alert.
- It tells me when something is wrong. An uptime monitor watched the site and its health check around the clock and alerted me if data went stale or the audit failed.
- A plan for every failure I could imagine. I wrote a race-day runbook: what each alert means, what to do if the sheet can’t be read, if its layout changes, if a deploy breaks the site, if the start is delayed. If the worst happened, I could upload the results by hand from race control and keep the site honest.
- Tests that check every number on screen. On race morning there were 112 unit tests and 100 browser tests. The browser tests open every page at several points in the race, in a real browser, and compare about 55,000 numbers with an answer key calculated separately from the site’s own code.
Changing a live site while the world watches
I planned a feature freeze for race week. I abandoned it, because the people using the dashboard kept asking for genuinely useful things, and the race itself kept teaching us. Over the race I made 122 commits (code, tests and notes), on top of 92 before the start.
Every one of those changes carried the same risk: fixing one thing and quietly breaking another. That was the hardest part of the whole week. Each change had to come with new tests for what it added, and pass every existing test for what was already there, before it could go anywhere near the live site. Then the same routine every time: test, deploy, check the new version is the one being served, run 25 checks against the live site, compare it with the official leaderboard, and look at it on a phone. Never in the minutes around the hourly bell, when traffic peaked. One click to roll back if anything looked wrong. By the end of the week the safety net had grown to 156 unit tests and 118 browser tests.
The two times it went wrong
It would be dishonest to say nothing broke. Two things did, and how they were handled is the part I’m proudest of.
The database buckled under the traffic (19 October, 1:11–1:15 pm CDT, about four minutes). As interest grew, every visitor’s request was reaching the small database behind the site, and it was being asked for the whole results file hundreds of times a minute. That afternoon it gave up for about four minutes, and around 6,300 requests failed. Pages that were already open kept their last results and tried again; nobody lost data, but some people couldn’t load the page.
Within 13 minutes of it recovering, a fix was live. The results now go into a fast key-value cache (Cloudflare KV) after every update, and visitors read only from that cache, never from the database. Behind it sits a last good copy, so even if both failed, viewers would see the most recent results rather than an error. Database queries fell from around 850 a minute to about a dozen, and the problem never came back. The same day I also made sure a page that loads while the server is struggling simply retries until it gets live results, rather than showing anything else.
The source sheet half-loaded (the same day, 8:29–8:39 pm CDT, about ten minutes). The official Google Sheet itself started showing “Loading…” instead of runners’ names. My site read that as a valid sheet with no results and, for ten minutes, showed every nation on zero. The sheet recovered on its own and the site came back with it, but I was ready to upload the last good results by hand if it hadn’t.
That same evening, within half an hour, a guard was written and tested: a read that looks broken (a “Loading…” runner, or far fewer rows than the last good read) is now refused. Visitors keep the last good results, the health check alerts me, and the site recovers by itself the moment the sheet does. Both of these became tests, so they can never quietly come back.
For the rest of the race, 124 hours from the start to the last bell, the safety nets did their job.
How many people it served
This is the part that still surprises me. These are Cloudflare’s own figures for race week, 17–23 October, counting real browsers only (automated bots excluded):
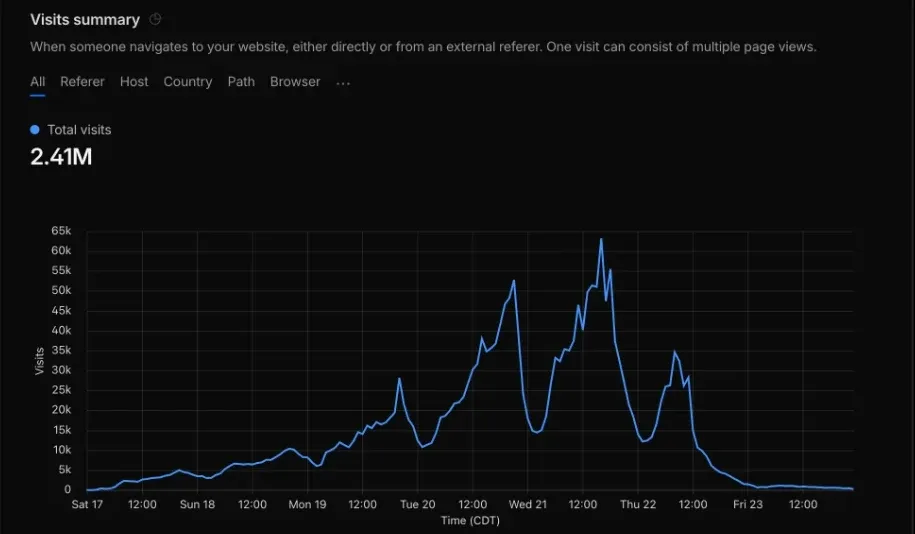
Visits during race week: the dashboard was opened about 2.41 million times, peaking on Wednesday 21 October as the United States and Australia fought for the lead.
- Opened about 2.41 million times, with about 6 million page views (about 3.6 million of them moves between the Race, Team and Runners tabs). A visit isn’t a person: someone who checked every morning counts every morning.
- Interest grew every day as the race narrowed: 36,000 visits on 17 October (the race started at 7 am CDT), 135,000 on the 18th, 283,000 on the 19th, 565,000 on the 20th, 898,000 on the 21st during the United States–Australia battle, and 462,000 on the 22nd, when the race ended.
- The busiest hour was 4–5 pm CDT on 21 October: about 63,000 visits, with at least 2,600 pages open at the same time on average.
- 158 countries and territories. The United States brought more than half the visits (1.39 million, 57.5%), then Australia (322,000), Canada (188,000), India (132,000), New Zealand (64,000), Japan (32,000), Israel (31,000) and South Africa (28,000).
- On phones. 81% of visits were on a phone (1.96 million), 18% on a computer; iPhones and iPads alone were 56%.
- People found it everywhere, in three almost equal shares: about 814,000 visits from Google search, 795,000 straight to the address (typed, bookmarked, or shared in an app that hides the source) and 682,000 from bigsbackyardultra.com. Instagram brought 57,000 and Facebook 33,000.
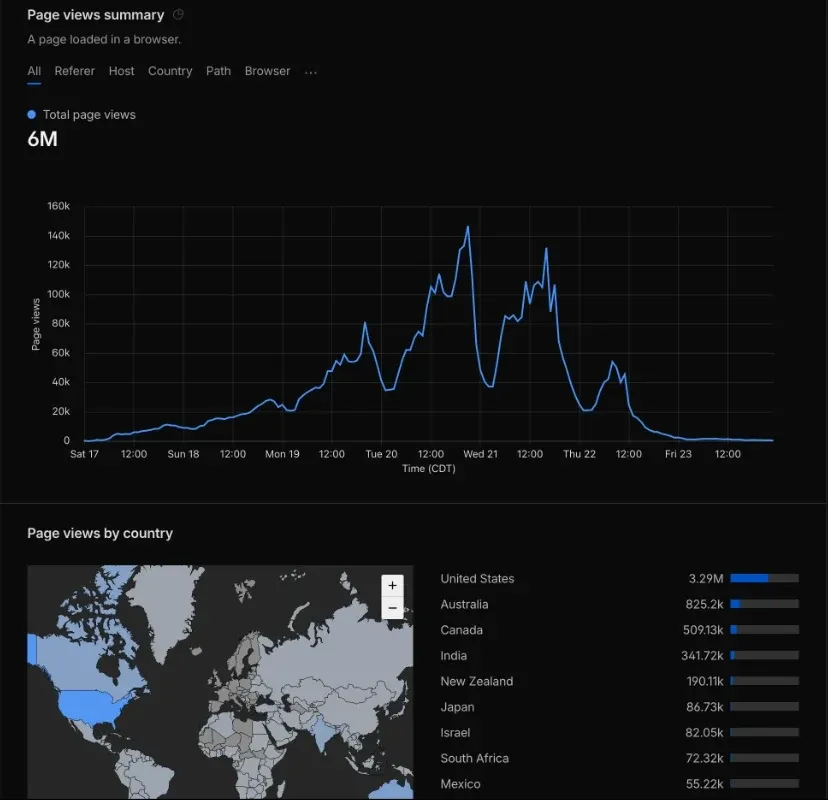
Page views by country: about 6 million in race week, from 158 countries and territories.
How these numbers are counted. They come from Cloudflare Web Analytics, which counts real browsers only; automated bots don’t run it. Its figures are sampled estimates, accurate to within a few percent rather than to the exact visit. A visit is someone arriving at the dashboard from outside it, so the same person coming back, reloading, or picking up their phone again counts again; Cloudflare doesn’t track individuals, so there’s no count of unique people. Pages open at the same time is my own estimate, worked out from the check every open page makes once a minute for new results. Phones pause those checks when they lock, so the real number was higher. I saved the raw figures on 24 October alongside the dashboard’s code.
Fast and reliable, by the numbers
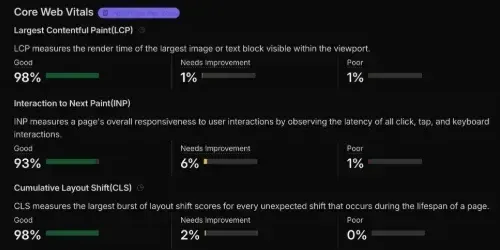
For real visitors, 98% of page loads were rated "good" for loading and for layout stability, and 93% for responsiveness. The median page loaded in 260 ms.
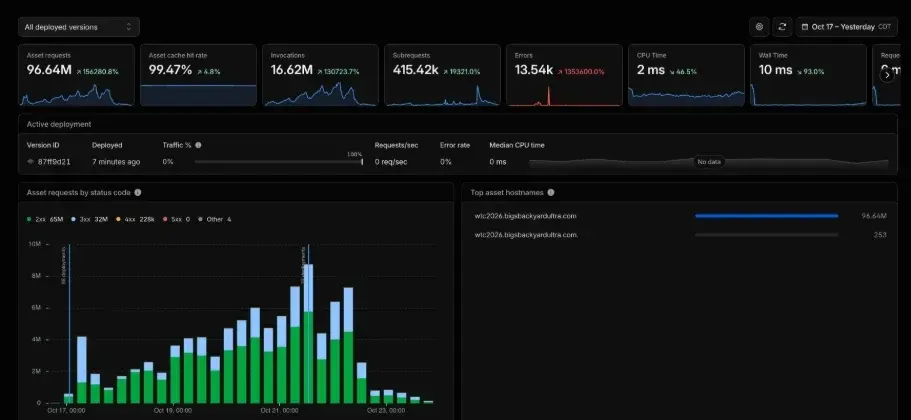
The live results service: 16.6 million requests from 14 to 24 October, 99.92% answered without an error, at a median of 2 ms of computing each.
- 16.6 million requests to the live results service from 14 to 24 October, 99.92% answered without an error. Of the 13,500 errors, almost half fall in those four minutes on 19 October, while pages kept showing the last good results.
- 2 milliseconds of computing per request at the median.
- Hosting: the plan is $5 a month; with the extra requests, October should come to about $7.
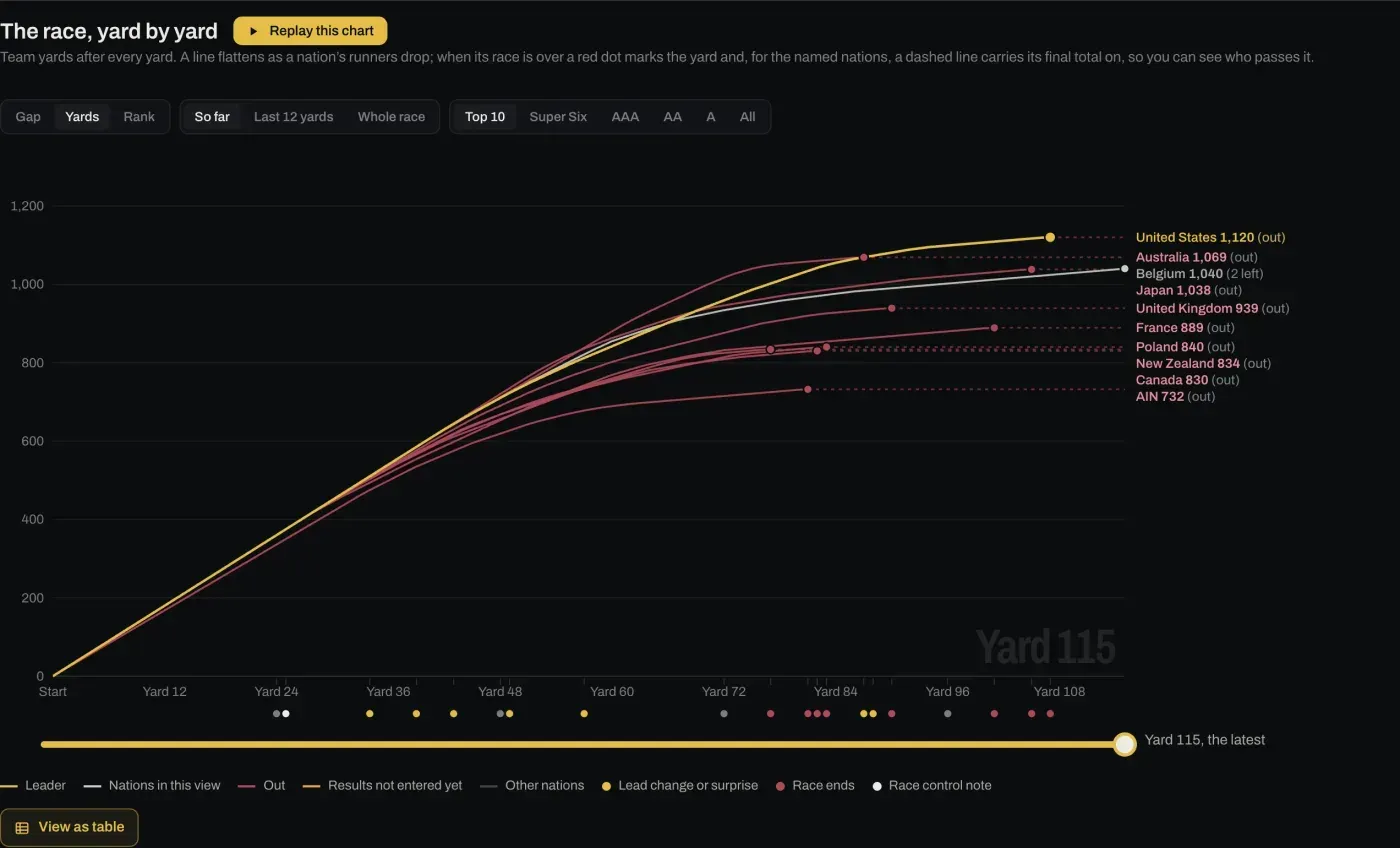
The race, yard by yard, as it stood after yard 115: one of the improvements that came from viewers' feedback during and after the race.
What I’d tell myself before the start
- Decide where the truth lives, and protect it. Because the sheet was the record, every failure on my side was recoverable.
- Build the safety nets before you need them. Last good copies, guards on bad data, alerts, a runbook. When things went wrong, I wasn’t inventing a plan at 1 pm or 8 pm, I was following one.
- Never let a visitor touch the database. I learned it the hard way on day three of the race; next time it’s how it starts.
- Tests are what let you keep improving under pressure. Without them, I would have had to stop changing the site the moment the race began.
- Be honest when something breaks. Fix it, write the test, and say what happened.
Thank you
To Gary Cantrell and the Big’s Backyard Ultra team for trusting me with the race, to Mike Dobies for the official sheet the whole thing stood on, to the race directors who typed in every result through five days and nights, and to the thousands of you who followed along, sent feedback, and made it better while it was running.
Have results, standings or a live event that deserve an audience? Let’s talk →