WTC 2026 dashboard
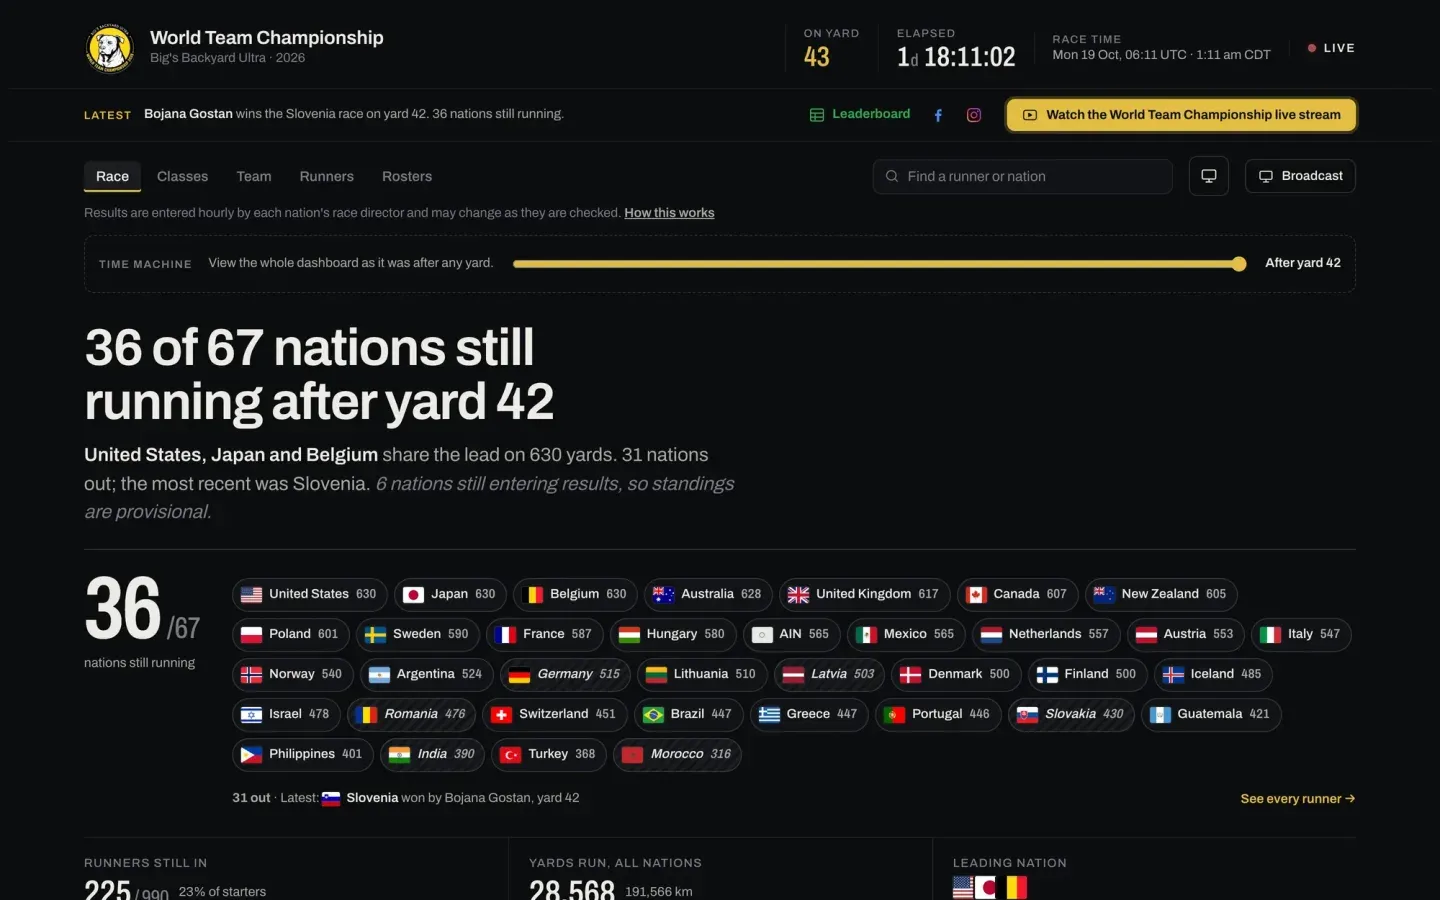
For the 2026 Big’s Backyard Ultra World Team Championship, 990 runners in 67 nations raced on their own courses at the same time, and 67 race directors typed each hour’s results into one shared Google Sheet. I designed, built and ran the live results dashboard that turned that sheet into something the world could follow, and I was the one on call for all 124 hours of the race.
This is the engineering view: the constraints, the architecture, the decisions, the two times it broke, and the numbers. The race story is in two posts: how it was built and how it was kept running.
At a glance
- Build: A couple of months of planning and design, then 4 days of building; live three days before the start
- Race: 124 hours, 17–22 October 2026, results every hour from 67 race directors in every time zone
- Reach: About 2.41 million visits and 6 million page views from 158 countries and territories in race week; 898,000 visits on the busiest day
- Load: 16.6 million requests to the live results service (14–24 October); at least 2,600 pages open at once in the busiest hour
- Reliability: 99.92% of requests answered without an error; two incidents, each fixed the same day
- Speed: A median of 2 ms of computing per request; a median page load of 260 ms; 98% of page loads rated “good” for loading
- Safety net: 156 unit tests, 118 browser tests and 25 production checks by the end of race week
- Cost: A $5-a-month plan; about $7 for October with the extra requests
The problem
The official results lived in a Google Sheet, typed by humans in 67 time zones, some within two minutes of the bell and some within twenty. Fans everywhere wanted to know, every hour, who was still running and which nation was ahead. The constraints:
- The organisers’ process could not change. Race directors and officials kept working in their sheet; the dashboard had to adapt to it, not the other way round.
- Correct beats fresh. A wrong number in front of tens of thousands of people is worse than a number that is a minute old.
- No traffic to learn from. The site met its audience for the first time when the race started.
- One person on call, day and night, for five days.
Architecture
- One reader, whatever the audience. The browser never talks to Google. The Worker’s minute job signs in with a read-only service account and reads the master leaderboard once a minute, behind a lock, so the load on Google stays the same whether ten people are watching or ten thousand. The 69 race-director sheets supply each race’s details, and were a fallback during the race.
- Check, then publish. Each reading is validated and normalised before anything is shown. If Google is down, a tab is renamed or the sheet is half-edited, the Worker keeps the last good results live, marks them “Delayed” and raises the alarm.
- D1 holds the truth; visitors never touch it. The D1 database holds the results file, the history, the race-control state and the data audits. Each new result is copied to KV, and viewers read only from KV, with a last good copy behind it. An edge cache keeps a 15-second copy, so most requests never reach KV at all. (Visitors originally read from D1; the first incident below changed that.)
- The browser does the maths. The page polls
/api/resultsand runs the race engine itself: standings, winners, the time machine and replays are all computed in the browser from that one file. When nothing has changed, the answer costs zero bytes. - The edge protects it. Cloudflare blocks heavy users of the API (more than 60 requests in 10 seconds), and Cloudflare Access puts an email PIN in front of race control and the admin API.
- Deploys in about a minute. A push to
maintriggers Workers Builds, which runs the type check, the unit tests (including the frozen-results check below), then the build, and deploys to every edge location. A failing test blocks the deploy. - It watches itself. Every 10 minutes an independent audit compares what visitors see with the sheet, runner by runner. UptimeRobot checks the home page and
/api/healthevery 5 minutes, and the health check fails when visitors would see something old or wrong. End-to-end tests run before each push, a smoke test runs against the live site after each deploy, and Cloudflare’s logs and analytics record errors and traffic.
Decisions and trade-offs
| Decision | Instead of | Why |
|---|---|---|
| TypeScript, Vite and d3, no framework | A component framework | A results page doesn’t need a virtual DOM. Fewer moving parts, and fast on old phones. |
| Keep the Google Sheet as the record | Moving organisers to a new tool | Their process stayed the same, and the record of the race was safe whatever happened to my site. |
| One Worker reading once a minute | Each browser reading the sheet | Load on Google independent of the audience; one place to check the data. |
| Stale but correct | Fresh but wrong | A minute-old number is recoverable; a wrong number in front of the world is not. |
| Standings move at the bell | Re-ranking as each result arrives | Finishes appear live, but places and totals change on the hour, so every page agrees. |
| A tie is a tie (=1) | A hidden tiebreak | Nobody is crowned leader by a rule no one can see. |
| Late is not out | Showing a missing result as out | A nation still entering results shows “awaiting results”, never out or behind. |
Proving every number is right
The hardest part of a live results page isn’t the charts. It’s making sure every number on screen is right. These counts are from the end of race week.
- An answer key. A second, deliberately simple program computes every expected number straight from the raw data, separately from the app.
- Tests that read the screen. A real browser opens every view at several points of a simulated race, reads the numbers off the page and compares about 55,000 of them with the answer key, on phones and desktops, in both themes, with zero accessibility violations allowed.
- The real Worker against a fake Google having a bad day. Browser tests run the actual Worker against a fake Google that misbehaves, and both of the failures in race week became tests too.
- Hostile input. Dozens of people can edit the sheet, so every name and note is escaped, and a test feeds hostile text into every field.
- The final result is frozen. On 24 October I saved a locked copy of the published outcome, after checking it independently against the raw results. On every test run, the current race engine recomputes the 2026 championship from the saved final results and compares it with that copy: the champion (the United States), the final and deciding yards, 67 nations, 990 starters and 32,827 total yards; every nation’s place (ties shared), yards, national winner and assist runner; and every place in the Super Six, AAA, AA and A classes. If anything differs, the build stops and nothing goes live. The test’s own instruction is to fix the change that caused it, never the locked file. It checks results, not wording or layout.
- History checked four times. Earlier championship totals were checked against the organisers’ workbook, the official leaderboards, per-runner results and the leaderboard keeper’s summary. Two nations’ 2024 results on the site turned out to come from an incomplete export, and were corrected.
| Layer | Count | What it proves |
|---|---|---|
| Unit tests | 156 | Race rules, the sheet reader, the audit, history against the official results |
| Browser tests | 118 | Every number on screen matches the answer key; phones; both themes; accessibility; failure handling |
| Production checks | 25 | Run against the live site after every deploy |
The two times it broke
1. The database buckled under the traffic. 19 October, 1:11–1:15 pm CDT.
- What happened: every visitor’s request reached the small D1 database behind the site, which was asked for the whole results file hundreds of times a minute. It failed for about four minutes.
- Impact: around 6,300 requests failed. Pages already open kept their last results and retried; nobody lost data, but some people couldn’t load the page.
- Fix: live within 13 minutes of recovery. Results go into the KV cache after every update, visitors read only from it, and a last good copy sits behind it. A page that loads while the server struggles now retries until it gets live results.
- Result: database queries fell from around 850 a minute to about a dozen, and the problem never came back.
2. The source sheet half-loaded. The same day, 8:29–8:39 pm CDT.
- What happened: the Google Sheet itself showed “Loading…” instead of runners’ names. The site read that as a valid sheet with no results.
- Impact: for ten minutes, every nation showed zero. The sheet recovered on its own and the site with it.
- Fix: within half an hour, a guard refuses any read that looks broken, such as a “Loading…” runner or far fewer rows than the last good read. Visitors keep the last good results, the health check alerts, and the site recovers by itself.
- Result: both failures became tests, so neither can quietly come back.
Shipping during a live race
I planned a feature freeze and abandoned it, because viewers kept asking for genuinely useful things. Over the race I made 122 commits, on top of 92 before the start, each through the same routine:
- Every test passes, or nothing is pushed. A failing test blocks the deploy.
- Never deploy in the minutes around the hourly bell, when traffic peaks.
- Wait until the new version is on every edge server, then run the 25 production checks, compare with the official leaderboard and look at it on a phone.
- Roll back with one click at the first sign of trouble.
What shouldn’t need a deploy didn’t. When Spain’s race was cancelled for weather after 24 yards, race control attached a note to the nation instead of showing “no winner”. When one runner’s result became a stray “y” in the sheet, the dashboard showed “awaiting results” rather than inventing an outcome, and race control now flags any cell it can’t read.
I built it with Claude Code as a pair programmer. What made that work was a living handoff document updated with every change, tests as the contract (“every number on screen matches the answer key”), and every figure I quoted on air checked three ways first: the site’s own logic, an independent calculation and the live page.
What I’d do from day one next time
- Never let a visitor touch the database. I learned it on day three of the race.
- Decide where the truth lives, and protect it. Because the sheet was the record, every failure on my side was recoverable.
- Build the safety nets before you need them: last good copies, guards on bad data, alerts and a runbook.
- Treat tests as what lets you keep improving under pressure. Without them, the site would have frozen the moment the race began.
Testimonial
This page is the more artistically beautiful interpretation of data I could ever imagine … Thank you for adding SO MUCH to the behind-the-screen spectator experience of the Backyard Ultra World Team Championship! … ANY sport would be fortunate to have you making their data look this good! (And in real time, no less!)